Leave a Message

Thank you for your message. We will be in touch with you shortly.

BY THE NUMBERS

CORAL GABLES MARKET UPDATE

2026 Year To Date 

Understanding the Coral Gables real estate market requires a close look at what is actually closing today. Using local MLS data, we can monitor how pricing, demand, and buyer behavior is shaping the current Coral Gables market in 2026.

Coral Gables continued to demonstrate strength, particularly at the higher end of the market:

  • 153 single family coral gables homes sold Jan. 1 - May 1
  • Median price: $2,150,000
  • Median price per sq ft: $925
  • Median Days on Market: 42
  • 95% of homes sold at asking price 
  • 32% of homes had at least 1 price reduction
     

For buyers and sellers alike, understanding these trends is essential to making confident, well-timed decisions in one of South Florida’s most enduring neighborhoods.

How much is your Coral Gables home worth?

  • Instant property valuation
  • Expert advice
  • Sell for more

DEEPER DIVE 18 MONTH SNAPSHOT

Coral Gables, FL  ·  18-Month Market Intelligence

Coral Gables
Residential Sales

Jan. 1, 2025 – Jun. 15, 2026
Deep-dive analysis of 954 closed transactions across all property types
954Total Transactions
$2.49BTotal Volume
$1.5MMedian Sale Price
54 daysMedian DOM

01

Market Overview

954
Total Sales
$2.49B
Total Volume
$1,500,000
Median Sale Price
$2,607,851
Average Sale Price
Skewed by trophy sales
94.8%
Median SP/LP Ratio
$788/sqft
Median $/Sq Ft
54 days
Median DOM
84 days average (outliers skew up)
75 days
Median CDOM

02

Sales by Property Type

Single Family

Transactions576
Share of Market60.4%
Total Volume$2.15B
Median Price$2,250,000
Avg Price$3,729,000
Median $/sqft$924
Median DOM48 days
Median SP/LP94.3%

Condominium

Transactions351
Share of Market36.8%
Total Volume$278M
Median Price$550,000
Avg Price$792,000
Median $/sqft$539
Median DOM61 days
Median SP/LP95.7%

Townhouse

Transactions26
Share of Market2.7%
Total Volume$60.3M
Median Price$2,050,000
Avg Price$2,319,000
Median $/sqft$800
Median DOM86 days
Median SP/LP93.2%

Villa

Transactions1
Sale Price$1,850,000
$/sqft$565
SP/LP92.7%
DOM113 days

03

Price Band Distribution

Sales Count & Volume by Price Tier — All Property Types
Under $500K
144 sales  ·  15.1%  ·  $51M vol
$500K – $1M
195 sales  ·  20.4%  ·  $140M vol
$1M – $2M
262 sales  ·  27.5%  ·  $394M vol
$2M – $3M
138 sales  ·  14.5%  ·  $343M vol
$3M – $5M
109 sales  ·  11.4%  ·  $413M vol
$5M – $10M
69 sales  ·  7.2%  ·  $451M vol
$10M+
37 sales  ·  3.9%  ·  $696M vol
The top 3.9% of transactions ($10M+) account for 28% of total dollar volume.

04

Monthly Closed Sales & Median Price Trend

Monthly Closed Transactions — Jan 2025 to Jun 2026 (partial)
61
Jan
'25
41
Feb
'25
58
Mar
'25
67
Apr
'25
65
May
'25
48
Jun
'25
56
Jul
'25
44
Aug
'25
43
Sep
'25
62
Oct
'25
44
Nov
'25
60
Dec
'25
39
Jan
'26
51
Feb
'26
56
Mar
'26
70
Apr
'26
66
May
'26
23*
Jun
'26
*June 2026 is a partial month. Gold bars = peak months by count. Brown bar = high-volume dollar month.
Median Sale Price by Month
Jan '25May '25Sep '25Jan '26May '26

05

Year-Over-Year: Jan–May 2025 vs. Jan–May 2026

Transaction Count
292
Jan–May 2025
282
Jan–May 2026
−3.4%
Fewer deals, but larger ones
Total Volume
$698M
Jan–May 2025
$837M
Jan–May 2026
+19.8%
Strong dollar volume growth
Median Sale Price
$1.60M
Jan–May 2025
$1.70M
Jan–May 2026
+6.2%
Steady price appreciation

06

Sales by ZIP Code

ZIP Code

Area

Sales

Share

Median Price

Avg Price

Total Volume

33134

Central Coral Gables / Downtown

504

52.8%

$1,236,000

$1,592,332

$802.5M

33146

South Coral Gables

235

24.6%

$1,695,750

$2,209,799

$519.3M

33133

Coconut Grove / West Gables fringe

80

8.4%

$691,250

$1,781,116

$142.5M

33156

Gables Estates / Old Cutler ultra-luxury

59

6.2%

$6,725,000

$10,789,888

$636.6M

33143

South Gables / Snapper Creek

45

4.7%

$5,800,000

$7,354,308

$330.9M

33158

Gables by the Sea / South Miami

26

2.7%

$1,825,000

$1,977,596

$51.4M

33155

West Miami fringe

4

0.4%

$880,000

$930,000

$3.7M

33144

Flagami fringe

1

0.1%

$877,500

$877,500

$878K

ZIPs 33156 and 33143 account for only 10.9% of transactions but generate 39.0% of total dollar volume.

07

Single-Family Homes: Pricing by Bedroom Count

Bedrooms

Sales

Median Price

Avg Price

Price Jump vs. Previous Tier

2 BR

50

$1,157,500

$1,187,130

3 BR

207

$1,500,000

$1,725,908

+$342,500 (+30%)

4 BR

163

$2,619,000

$2,953,492

+$1,119,000 (+75%)

5 BR

99

$4,235,000

$5,143,878

+$1,616,000 (+62%)

6 BR

36

$7,587,500

$10,930,625

+$3,352,500 (+79%)

7 BR

16

$11,662,500

$15,046,094

+$4,075,000 (+54%)

8 BR

4

$14,512,500

$22,281,250

+$2,850,000 (+24%)

9 BR

1

$17,250,000

$17,250,000

The 3BR→4BR jump is the largest proportional price inflection point in the market: buyers pay a $1.1M median premium for that extra bedroom.

08

Key Market Insights

01
Volume is up sharply; transaction count is flat. Jan–May 2026 shows +19.8% in dollar volume versus the same period in 2025, with 3.4% fewer transactions. Buyers are spending more per deal. This is a price-appreciation story, not a volume-surge story.
02
The ultra-luxury ZIP codes carry a disproportionate share of total value. ZIP 33156 (Gables Estates, Old Cutler) generated $636M from just 59 sales — an average of $10.8M per transaction. Combined with 33143, those two ZIPs represent 10.9% of transactions but 39% of total volume.
03
The 3BR→4BR price jump is the single largest value threshold in the market. Buyers pay a median premium of over $1.1 million — a 75% price increase — to move from a 3-bedroom to a 4-bedroom single-family home. No other bedroom step-up comes close in dollar terms.
04
Luxury homes take longer to sell, but not dramatically so. Homes above $5M have a median DOM of 74 days versus 56 days for sub-$1M properties. The gap is measurable but not extreme — well-priced luxury inventory is moving at a steady pace.
05
Condos negotiate less and close faster than single-family. Condos show a 95.7% SP/LP ratio versus 94.3% for single family, suggesting slightly less negotiating room. Median DOM is 61 days for condos versus 48 days for single-family — condos take modestly longer to close.
06
Arvida Parkway and Reinante Avenue define the top of the market. Four of the 10 highest single-family transactions closed on these two streets, including the period's highest sale at $50M (41 Arvida Pkwy) and the second-highest at $47M (625 Reinante Ave).
07
April 2026 was the most active month in the dataset. With 70 closed transactions and a median sale price of $1.975M, April 2026 combined deal volume and price strength in a way no other month matched. Spring 2026 arrived with momentum on both measures.
main secondary

Get To Know Us

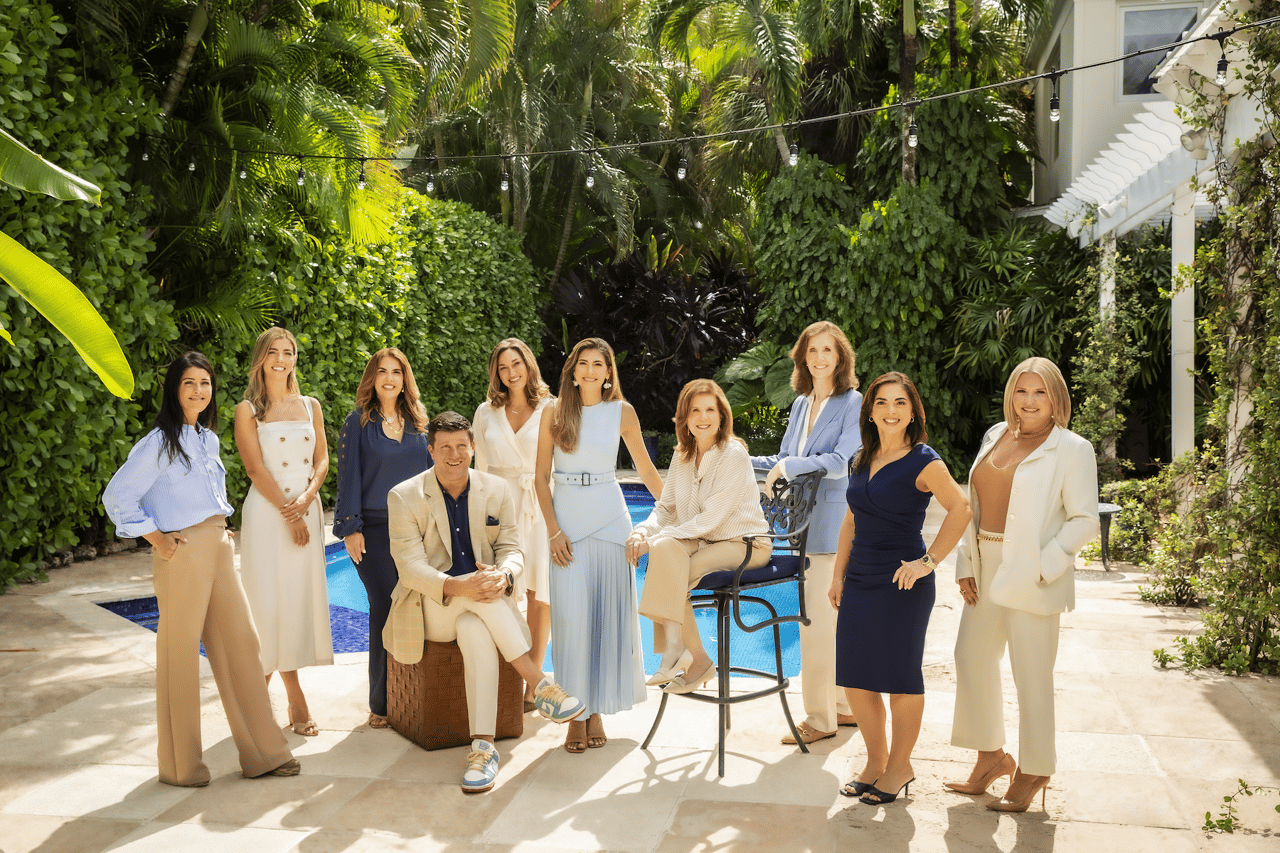
Our team is ready to deliver results that consistently surpass expectations. With our deep-rooted local expertise and strategic guidance, we sell homes ensuring our clients reap the rewards of their investments.