By Carole Smith & Cristina Formosa | Smith Formosa Team at Compass Source: MLS Closed Sales Data, January 1 – June 30, 2026 | 343 Transactions
If you own a home in Coral Gables, there's a good chance one of your biggest assets quietly became more valuable this year. We analyzed every residential closing in Coral Gables from January through June 2026. One finding stood out above everything else.
Buyers spent $200 million more — without buying more homes.
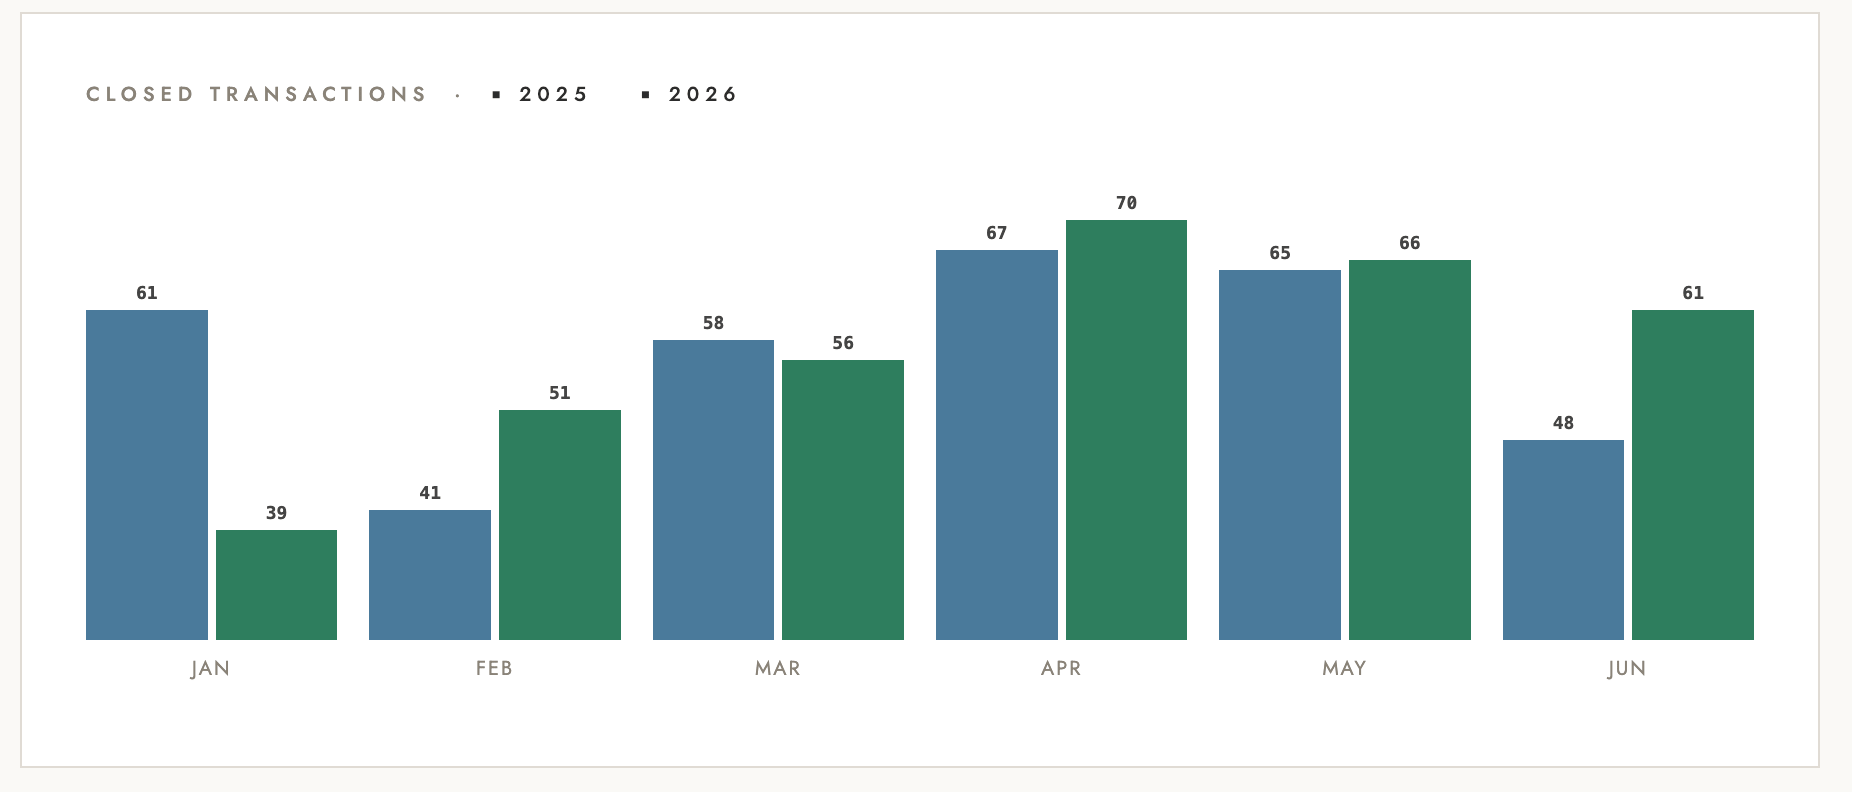
343 homes sold in the first half of 2026. Nearly identical to the first half of 2025. But total volume jumped from $800.6 million to nearly $1 billion. Same streets. Same neighborhoods. Significantly more money changing hands.
That doesn't happen because of one outlier sale. It happens because buyers who want to be in Coral Gables are willing to pay more to get here — and they're doing it consistently, across every price tier.
What That Looks Like on the Ground
One neighborhood illustrates it clearly. Gables Estates saw volume nearly triple year over year — from $96.6 million to $272.3 million on just nine additional transactions. Median price there rose 35.8%.
But Coral Gables is not one market. Some neighborhoods accelerated. Others softened. The full breakdown — ZIP code by ZIP code, price tier by price tier — is in our mid-year report.
Here's one At A Glance chart included in the report:
The Detail Most Sellers Miss
Speed and price are not in conflict here. Homes priced correctly at launch sold in under 30 days and closed at a median of 98.7% of list price. Homes that sat beyond 180 days closed at 92.4%.
On a $2 million home, that difference is over $125,000.
Knowing which side of that line your home falls on starts with understanding exactly where your property sits in today's market — not the market generally, but your street, your ZIP code, your price tier.
The Full Picture Is in the Report
Our mid-year report covers every neighborhood in Coral Gables — with detailed insight.
If you'd rather talk through what it means for your property directly, call us at 305.775.5330.
Data based on reported MLS sales Jan - June 2026 at time of analysis.